HF-START Web Tool Instruction Manual
Before using the "HF-START Web Tool," please check your browser settings to enable Javascript and
window pop-ups.
Our website supports the following web browsers: MacOS Safari, Microsoft Edge, Mozilla Firefox, and Google Chrome.
In this web tool for HF radio propagation, users can input parameters by themselves and check the results on the bases of their inputs.
1. Calculation input window
Please input/select parameters for the simulation.
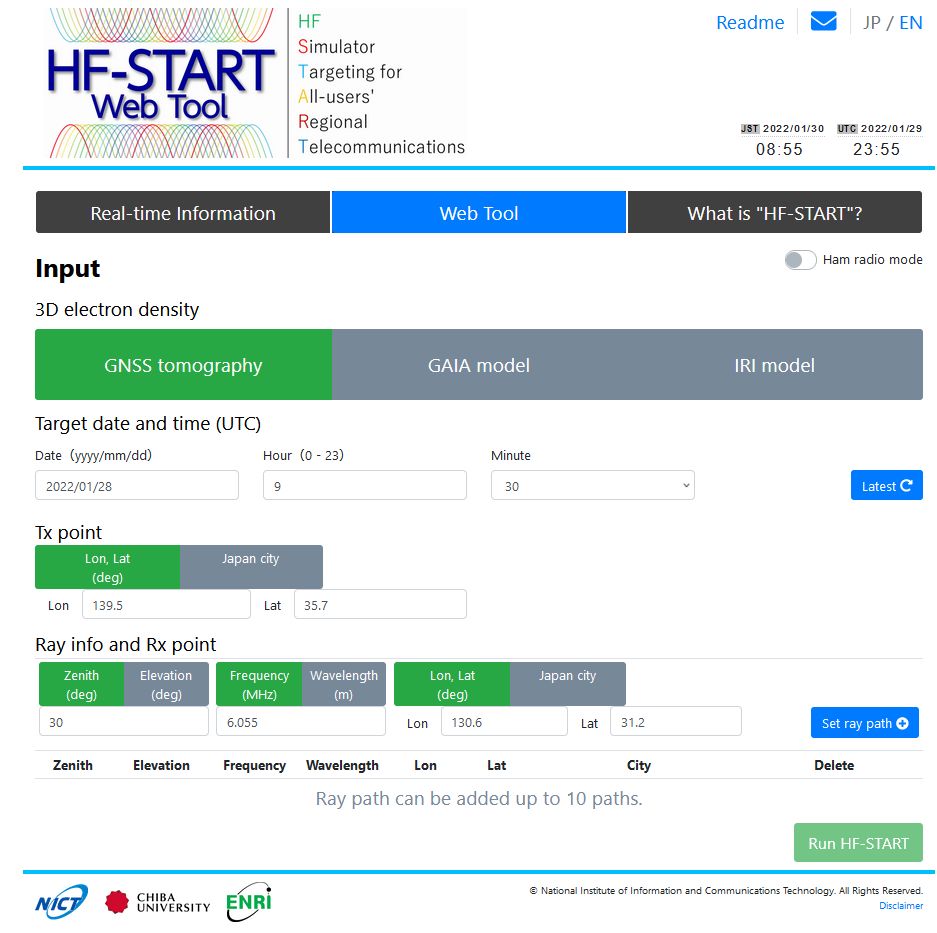
- If you wish, you can turn on the Ham radio mode, which is off by default.
- Select the 3D electron density option.
- Choose a date and time.
- Set transmitter point.
- Set transmission angle, frequency or wavelength, and receiver point, and then click "Set ray path."
- Click "Run HF-START" to run the simulation.
If the distance between the radio wave transmission and reception points is large, the calculation process may take several minutes.
2. Calculation result window
After the calculation is completed, the result window will automatically pop up.
*If the pop-up window is restricted, please change the setting to allow pop-up.
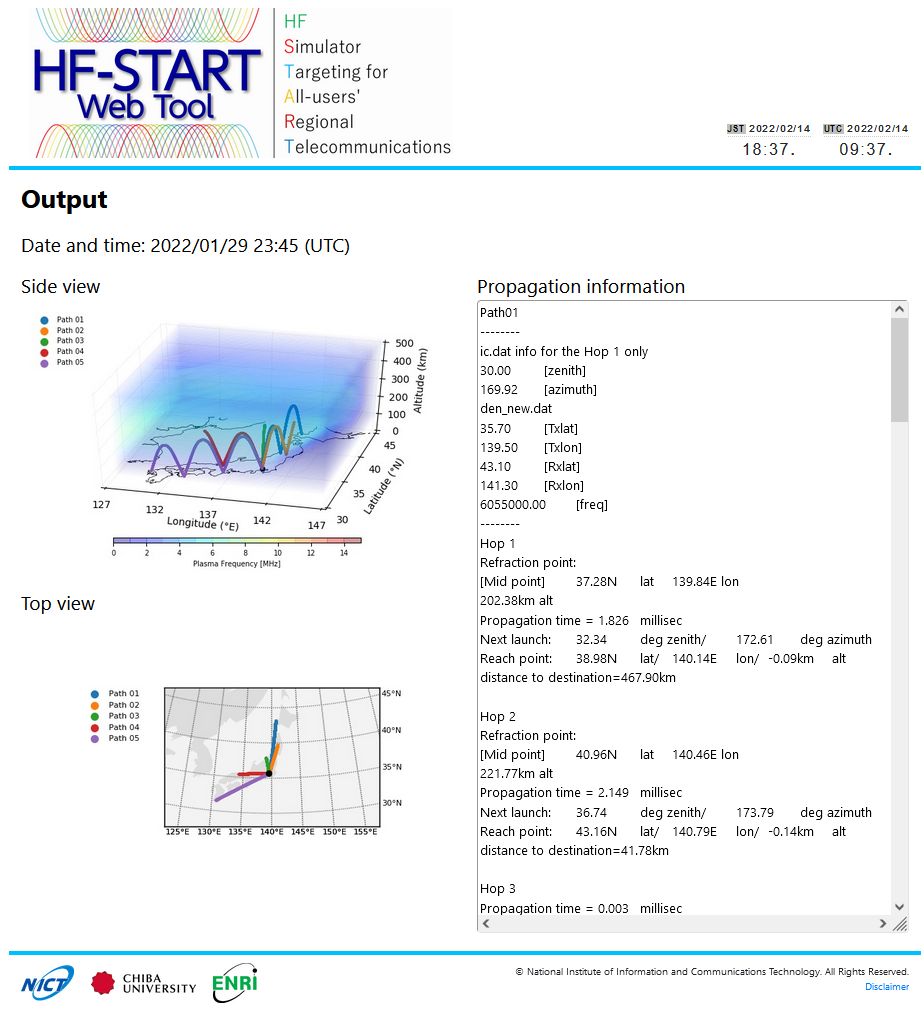
"Side view" and "Top view" images can be enlarged by clicking on these images.
The legend in the figure indicates the total amount of radio wave attenuation caused by ionospheric absorption, transmission loss in free space, and ground reflection losses for each Tx-Rx path.
"Propagation information" can be scrolled.
Click "AdvancedSettings" to open the advanced settings window.
3. Detailed information
3-a. 3D electron density option
There are three options: "GNSS tomography," "GAIA model," and "IRI model".
*"GNSS tomography" is the default option.
-
GNSS tomography: 3-D real-time ionospheric tomography over Japan based on GNSS observations
https://www.enri.go.jp/cnspub/tomo3/ -
GAIA: Ground-to-topside model of Atmosphere and Ionosphere for Aeronomy
https://gaia-web.nict.go.jp/index_e.html -
IRI: Widely used International Reference Ionosphere model. IRI-2016 model is used in the HF-START service.
http://irimodel.org/
3-b. Target date and time (UTC)
You can set the date and time (UTC) for calculation.
*The most recent date and time, which can be used in the calculation, are set as default values. You can also click
the "Latest" button to make sure that it is the most recent time for calculation. Date and time can be inputted
freely in the available data range.
3-c. Transmitting point for calculation
You can set the transmitting point into fields.
*"Lon: 139.5, Lat: 35.7" are set as default values of the transmitting point longitude and latitude.
You can enter the transmitting point by the numerical input of longitude and latitude or by selecting from major
cities in Japan and the world.
You can switch the format with the button at the top of the input field.
**Selectable transmitting points differ between "GNSS tomography," "GAIA model," and "IRI model," as shown
in the following table.
| GNSS tomography | GAIA model | IRI model | |
|---|---|---|---|
| Tx lon [degree E] | 128 to 147 | -180 to 180 | -180 to 180 |
| Tx lat [degree N] | 30 to 46 | -90 to 90 | -90 to 90 |
3-d. Transmission information and receiver point for calculation
You can set transmission information and receiver point into fields, and up to 10 sets of these can be registered
by clicking "Set ray path" for the 1st set and "Add ray path" for the 2nd to the
10th sets.
The registered set can be
removed by clicking the "X" mark.
Depending on whether the Ham radio mode is on or off, you can input parameters differently, as written below. At each mode, multiple formats of input are possible. Select the preferred option at the top of each input
field.
[When Ham radio mode is OFF]
- Transmission angle: You can enter the zenith angle (degree) or elevation angle (degree) numerically.
- Frequency: You can enter the frequency (MHz) or wavelength (m) numerically.
- Receiver point: You can enter the transmission point by the numerical input of longitude and latitude or by selecting from major cities in Japan and the world.
[When Ham radio mode is ON]
- Transmission angle: You can enter the launch angle (degree) numerically.
- Frequency: You can chose from the list of commonly used frequency bands (MHz)/ wavelengths (m).
- Receiver point: You can choose from major cities in Japan or DXCC entities.
- For the "GAIA model" and "IRI model," you can select the long path calculation by clicking the "Long-path" checkbox.
**The available ranges for "GNSS tomography," "GAIA model," and "IRI model" are shown in the following table.
| GNSS tomography | GAIA model | IRI model | |
|---|---|---|---|
| Zenith angle [degree] | 0 to 79.9 | 0 to 79.9 | 0 to 79.9 |
| Elevation angle [degree] | 10.1 to 90 | 10.1 to 90 | 10.1 to 90 |
| Launch angle [degree] | 10.1 to 90 | 10.1 to 90 | 10.1 to 90 |
| Frequency [MHz] | 3 to 30 | 3 to 30 | 3 to 30 |
| Wavelength [m] | 10 to 100 | 10 to 100 | 10 to 100 |
| Rx lon [degree E] | 128 to 147 | -180 to 180 | -180 to 180 |
| Rx lat [degree N] | 30 to 46 | -90 to 90 | -90 to 90 |
3-e. Error massages
| Dialogue title | Dialogue massage | Meaning |
|---|---|---|
| Service Unavailable | Please try again later. | Server connection was failed. |
| No density data | Specified time's density data does not exist. | For some reason, specified time's density data does not exist. |
| Time-out Error | Your process has timed out. | Calculation request has timed out. |
| Error on processing program | Process ID: [ID] | Calculation request was failed on [ID]. |
| This server is too busy | Please try again after a while. | Currently, the server capacity is overflown. |
| Internal Server Error | Unexpected error has occurred. | Unexpected error has occurred. |
3-f. Propagation information
The propagation information is available for every Tx-Rx path. Information from each Tx-Rx path is started with "Pathxx", where xx is the path number (i.e., 01-10). The zenith angle (degree) and azimuth angle (degree) of the first hop, Tx latitude (degree) and longitude (degree), Rx latitude (degree) and longitude (degree), and the frequency (MHz) are listed.
Next, the propagation information from each hop is listed. At each hop, "Refraction point" indicates the highest point [latitude (degree), longitude (degree), and altitude (km)], where the radio wave refracts back from the ionosphere. "Propagation time" in milliseconds indicates the time when the radio wave propagates in one hop from one point to another point on the ground. "Next launch" indicates the zenith angle (degree) and azimuth angle (degree) for launching the next hop. "Reach point" indicates the point [latitude (degree), longitude (degree), and altitude (km)], where the radio wave reaches the ground. It is also the position where the next hop will be launched. "Distance to destination" indicates the nearest distance on the ground from the reach point to the Rx.
When no more hops can propagate to the Rx, the message "No more hop is possible from now" will be displayed. "Max hop" indicates the maximum hop number that the radio wave can propagate from Tx to Rx. Only the ground-to-ground propagation is counted as one hop.
4 "AdvancedSettings" window
When clicking "AdvancedSettings," the advanced settings window will automatically pop-up.
Please also refer to the advanced settings usage page.
*If the pop-up window is restricted, please change the setting to allow pop-up.
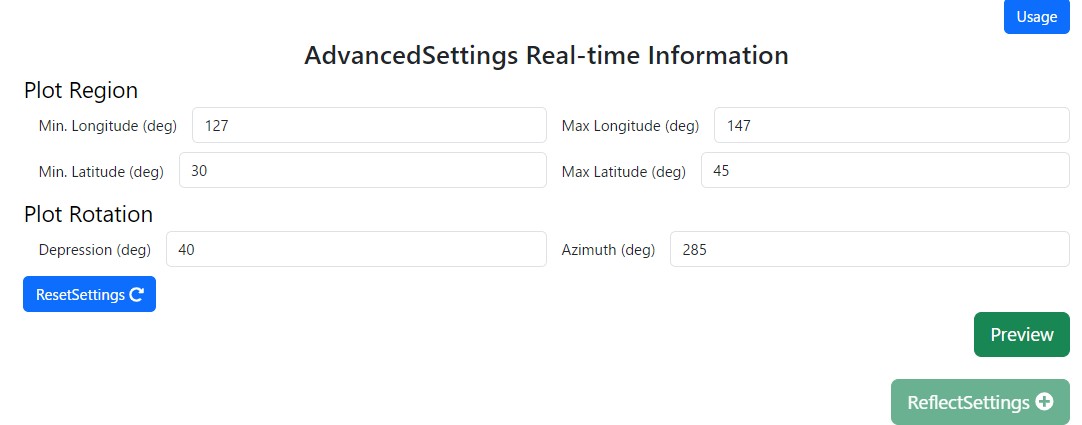
- Set min longitude, max longitude, min latitude, and max latitude.
- Set depression and azimuth for the rotation of the figure.
- Click "Preview" to run the replot.
- Click "ReflectSettings" to reflect the replotted image on the result window.
- Click "Usage" to display the parameter description page.
- Click "ResetSettings" to set the default values for creating 3D side views in the input fields.
4-a. Plot region
You can set the longitude range and latitude range.
The default settings for "GNSS tomography," "GAIA model," and "IRI model" are shown in the following table. You can reset these default values by clicking the "ResetSettings" button.
| GNSS tomography | GAIA model | IRI model | |
|---|---|---|---|
| Min.Longitude (deg) | 127 | 0 | 0 |
| Max Longitude(deg) | 147 | 360 | 360 |
| Min.Latitude(deg)[degree N] | 30 | -90 | -90 |
| Max Latitude(deg)[degree N] | 45 | 90 | 90 |
4-b. Plot rotation
You can set depression and azimuth into fields.
The depression is the angle at which you look down on the image; a larger depression will make the image appear as if it is being viewed from a higher perspective, and a depression of 0 degrees will make the image appear as if it is being viewed from directly on the side.
The azimuth is based on a diagram viewed from the viewpoint on the east side facing west (angle = 0 degrees), and the diagram rotates horizontally and clockwise by an angle; for example, 270 degrees is the diagram viewed from the viewpoint on the south side facing north.
When you open the AdvancedSettings window, the default settings are "Depression: 40" and "Azimuth: 285".
You can reset these default values by clicking the "ResetSettings" button.
5. Reference
5-a. HF-START
- K. Hozumi, M. Ishii, S. Saito, T. Maruyama, H. Nakata, and T. Tsugawa, "HF-START: Application in Aid of Radio Communications/Navigation", In: Electronic Navigation Research Institute (eds) Air Traffic Management and Systems III. EIWAC 2017. Lecture Notes in Electrical Engineering, vol 555. Springer, Singapore, https://link.springer.com/chapter/10.1007/978-981-13-7086-1_19.[Paper link]
- K. Hozumi, T. Kondo, S. Saito, H. Nakata, T. Maruyama, T. Tsugawa, and M. Ishii, "Low Cost Development of HF Receiver Prototype for HF-START Field Campaign", 2018 2nd URSI Atlantic Radio Science Meeting (AT-RASC), Meloneras, Spain, pp. 1-4. doi: 10.23919/URSI-AT-RASC.2018.8471477, 2018. (Young Scientist Award) [Paper link]
5-b. GNSS tomography
- S. Saito, S. Susuki, M. Yamamoto, A. Saito, "Real-time ionosphere monitoring by three- dimensional tomography over Japan", Inst Navig 64:495–504. https://doi.org/10.1002/navi.213, 2017. [Paper link]
5-c. GAIA
- Tao, C., H. Jin, Y. Miyoshi, H. Shinagawa, H. Fujiwara, M. Nishioka, and M. Ishii, "Numerical forecast of the upper atmosphere and ionosphere using GAIA", Earth Planets Space, 72:178, https://doi.org/10.1186/s40623-020-01307-x, 2020. [Paper link]
5-d. IRI
- D. Bilitza, D. Altadill, V. Truhlik, V. Shubin, I. Galkin, B. Reinisch, and X. Huang, "International Reference Ionosphere 2016: From ionospheric climate to real-time weather predictions", Space Weather, 15, 418-429, doi:10.1002/2016SW001593, 2017. [Paper link]


© National Institute of Information and Communications Technology.
All Rights Reserved.
Disclaimer